
Traffic Analytics Dashboard: Measure Your Website's Performance
Measure website traffic effectively with three key performance indicators (KPIs):
Understanding Traffic KPIs
- Unique Visitors:
- Estimates total individual visitors
- Tracked via 2-year browser cookie
- Represents actual audience size
- Note: Resets with cleared cookies or different browsers
- Visits:
- Represents single browsing sessions
- Uses 30-minute cookie duration
- Multiple visits possible per day
- Sessions reset at midnight
- Best indicator of engagement
- Pageviews:
- Counts actual page requests
- Includes main pages, collections, password-protected content
- Excludes image URLs, scripts, and 404 pages
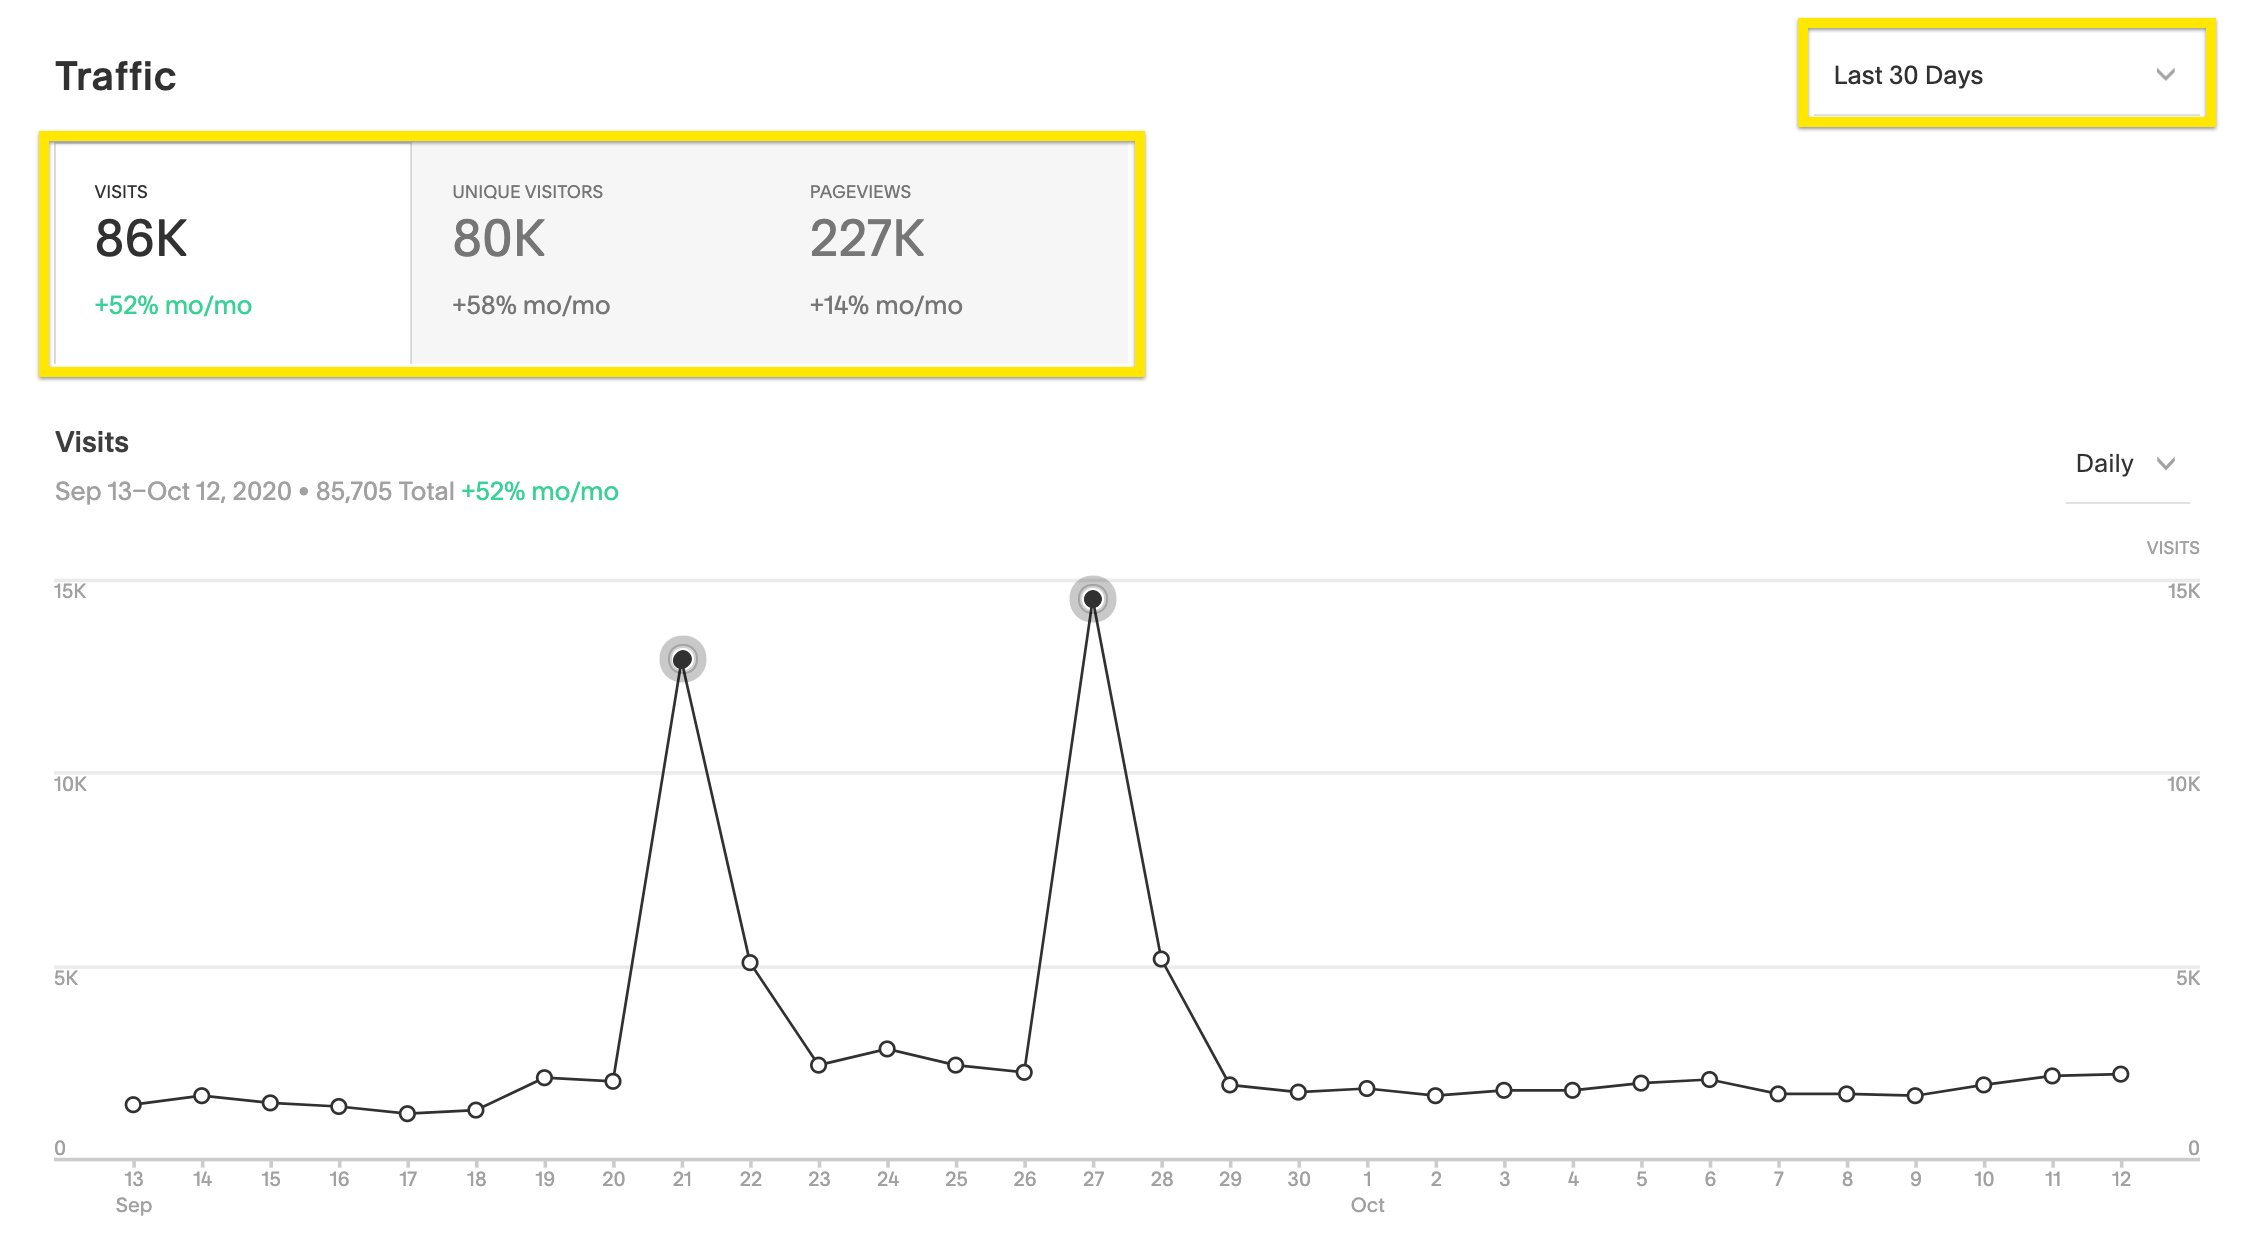
Web traffic line graph
Index Page Views (Version 7.0)
- Secondary pages from Index: Counts toward Index Page
- Direct URL access: Counts toward individual page
Traffic Analysis Tools
The Analytics panel provides:
- Date range filtering (from January 2014)
- Percentage change comparisons
- Traffic alerts
- Interactive line graphs with time scale options
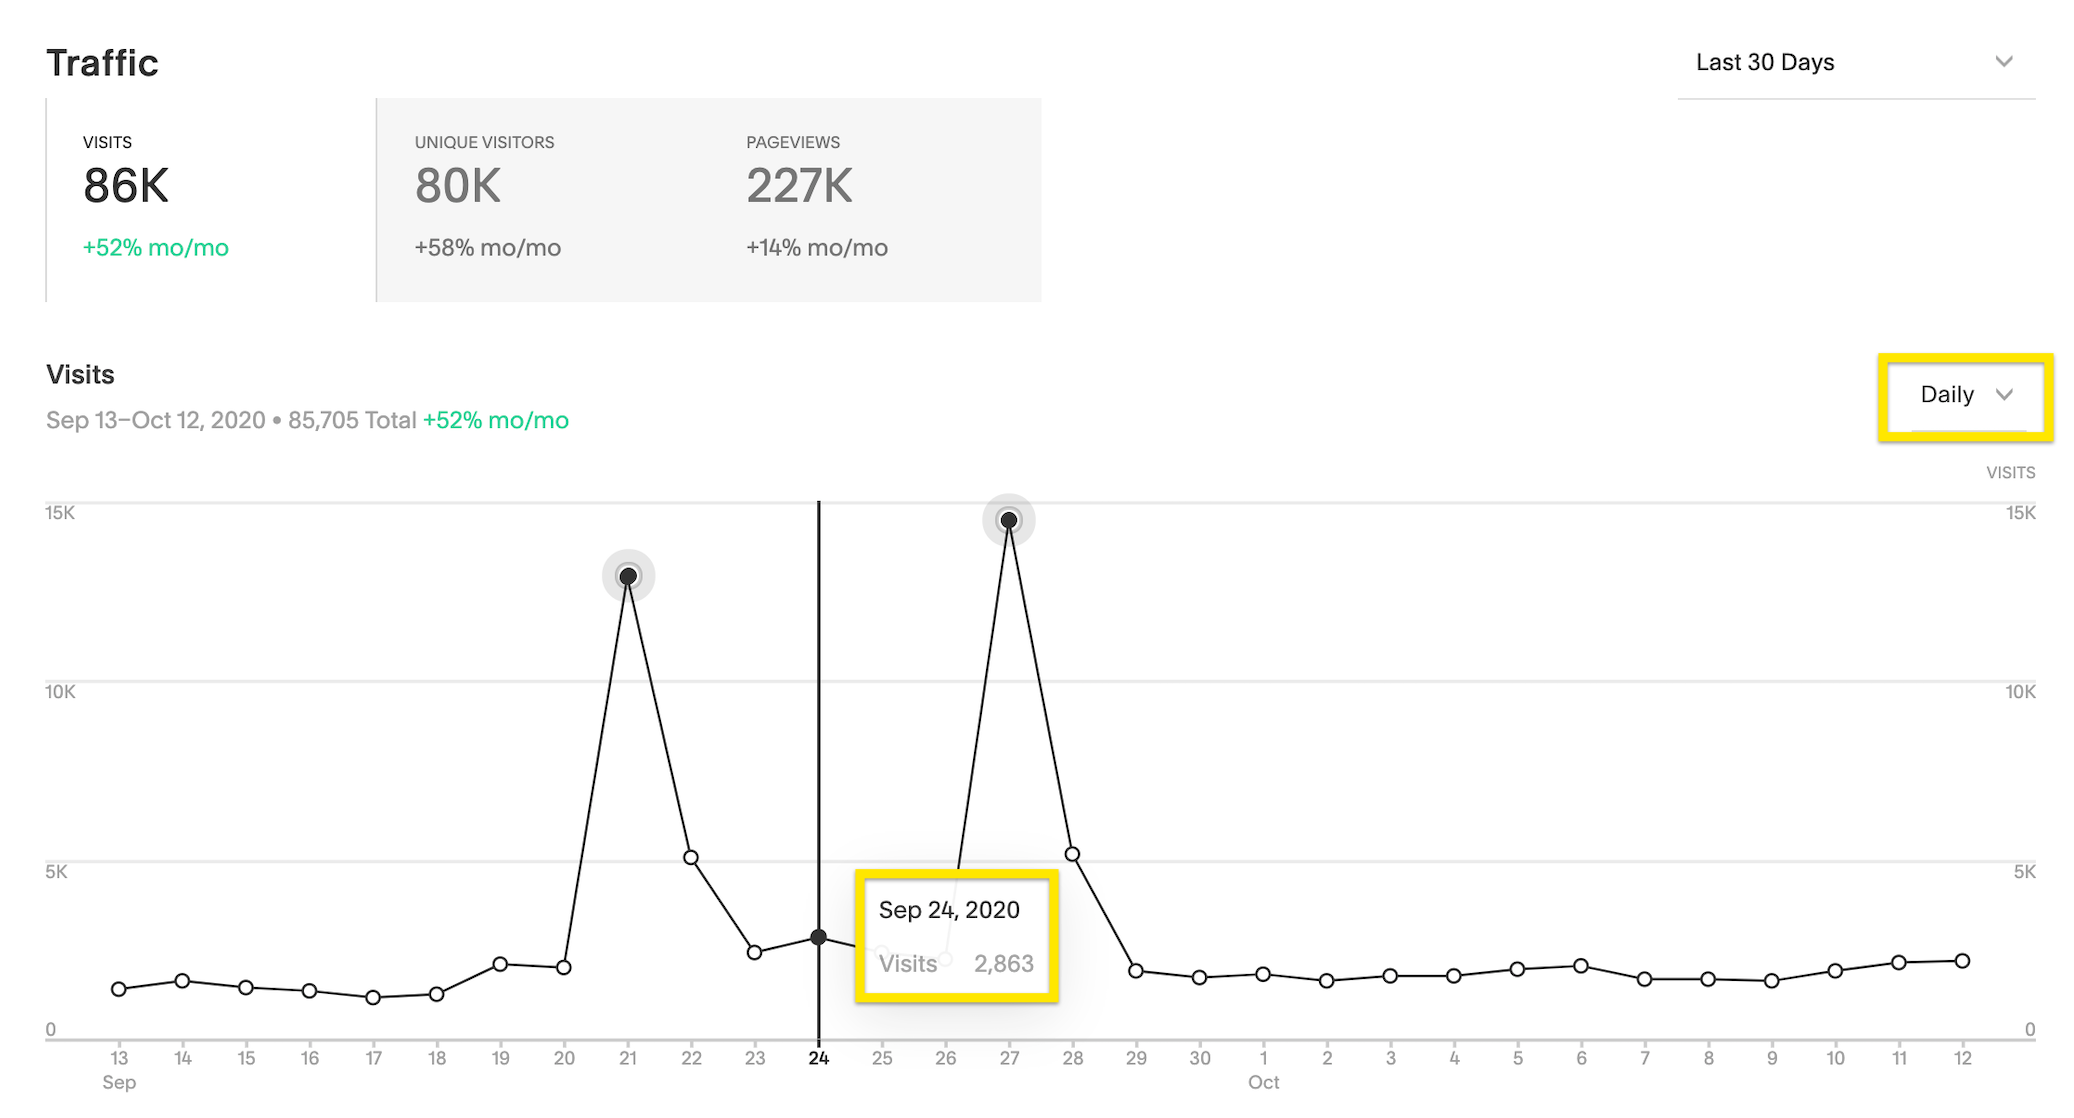
Website traffic graph
Detailed Visit Breakdowns
View visits categorized by:
- Device type (mobile, computer, tablet)
- Traffic sources
- Browser types
- Operating systems
Important Note
Chrome's "Do Not Track" setting may affect analytics:
- Each page view counts as new visitor
- May inflate direct traffic numbers
- View counts remain accurate
- Enabled manually by users (off by default)
Related Articles

Track and Manage Website Traffic Anomalies with Automated Notifications